Skip to main content.
Contact Us Today!
320.632.5466
Email Us
Toggle navigation
About
Our Partners
County Government
Staff
Our Members
Our Communities
Morrison County
Motley
Randall
Swanville
Bowlus
Upsala
Little Falls
Royalton
Pierz
Community Resources
Community Links
Doing Business
Labor Force
Transportation and Utility Services
Real Estate Resources
Finance Tools
Tourism
News
Facebook
Twitter
LinkedIn
Email
Print
Follow Us!
Facebook-f Image
Twitter Image
Home
Our Communities
Little Falls
Our Communities
Locations
Bowlus
View The Data
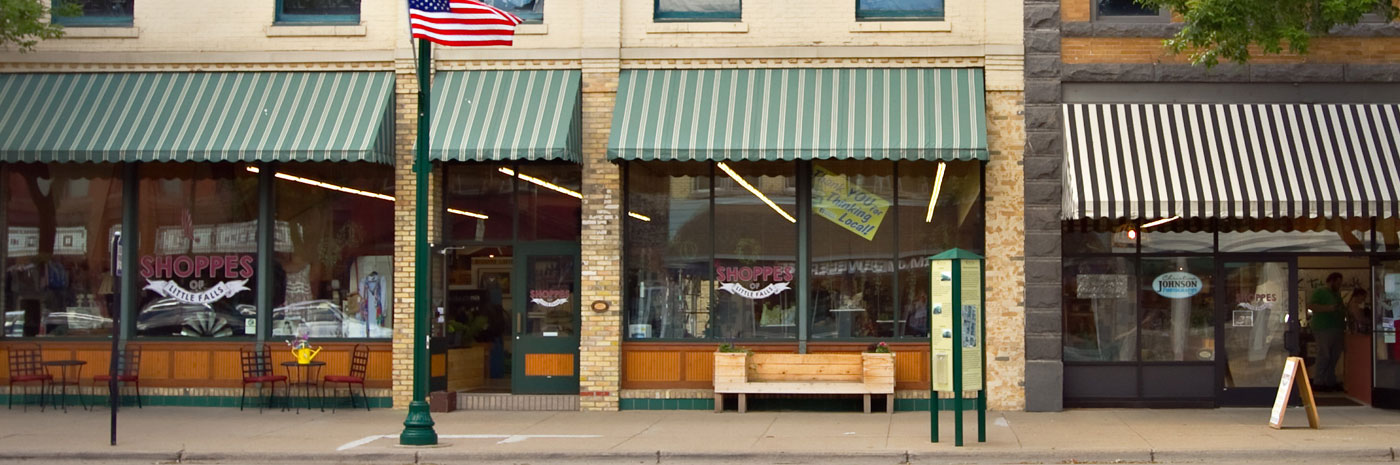
Little Falls
View The Data
Morrison County
View The Data
Motley
View The Data
Pierz
View The Data
Randall
View The Data
Royalton
View The Data
Swanville
View The Data
Upsala
View The Data
View Custom Report
List of JavaScript dependencies not enabled: share-links.js, app.js, and universal-buttons.js Additional Note: Our module pages support additional JS to fully function but still will be traversable.